A 60 SECOND GLANCING EYE ON BUSINESS, MARKETS & ECONOMY

Global Markets


Live World Indices are powered by Investing.com
Showing posts with label Bakken. Show all posts

Saturday, 27 February 2016

Bad News - Texas Oil Production Peaking?


 Chart Patterns  Indicate Texas Oil Production Facing Peak
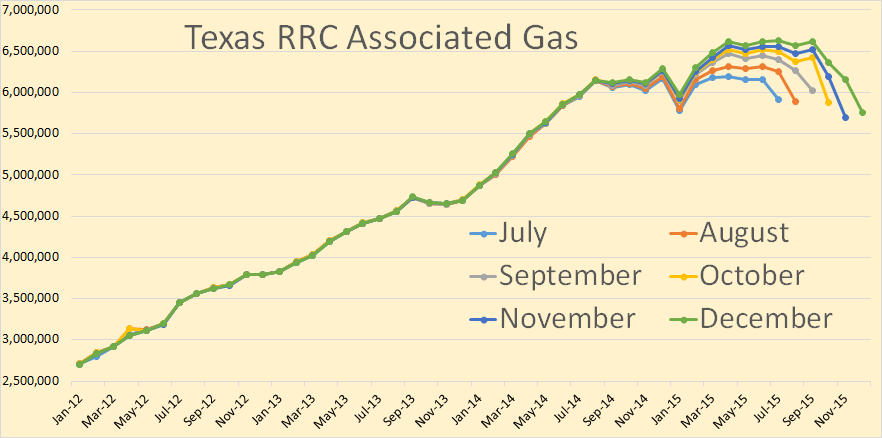
Texas Assciated Gas
The Texas RRC Oil and Gas Production Data is out. There appeared to be no decline in December production and may have even been a slight increase. 
The Texas RRC data is incomplete and only gives an indication as to whether Texas production increased or decreased. The data appears to droop because each month the the Texas Railroad Commission receives a little more data and the totals increase, little by little, month by month, until after many months the data is complete.
In our  charts we posted over the past six months of data in order to give some indication as to whether production is increasing or decreasing. The final data is through December and the EIA data is through November.
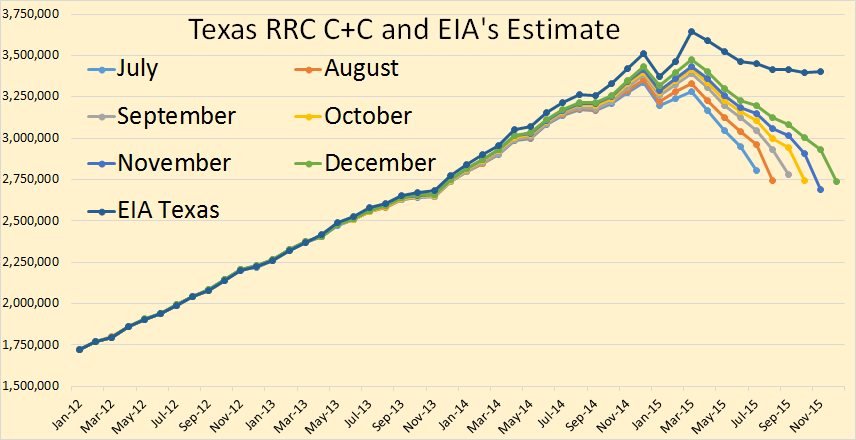
Texas C+C
Texas crude plus condensate declined a little in November but seemed to make up that decline in December. Total Texas C+C seems to be on a flat plateau, declining in Eagle Ford but making up that decline in the Permian and the rest of Texas.


Image result for eagle ford drilling


The EIA estimates the final Texas data through November. They have Texas peaking in March and down about a quarter of a million barrels per day since that point.
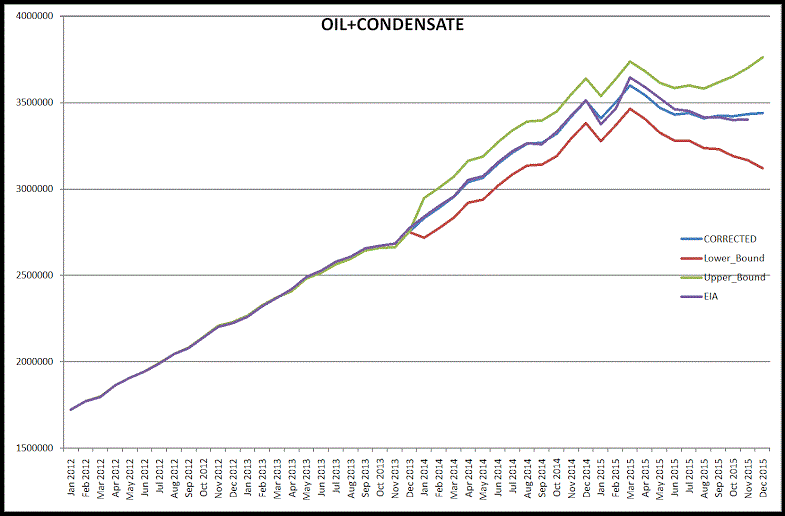
Dean C+C
Dr. Dean Fantazzini, Deputy Head of the  Chair of Econometrics and Mathematical Methods in Economics at the Moscow School of Economics, Moscow State University, has worked out an algorithm that predicts what the final production numbers will look like. He has C+C relatively flat the last few months and slightly above the EIA estimate.


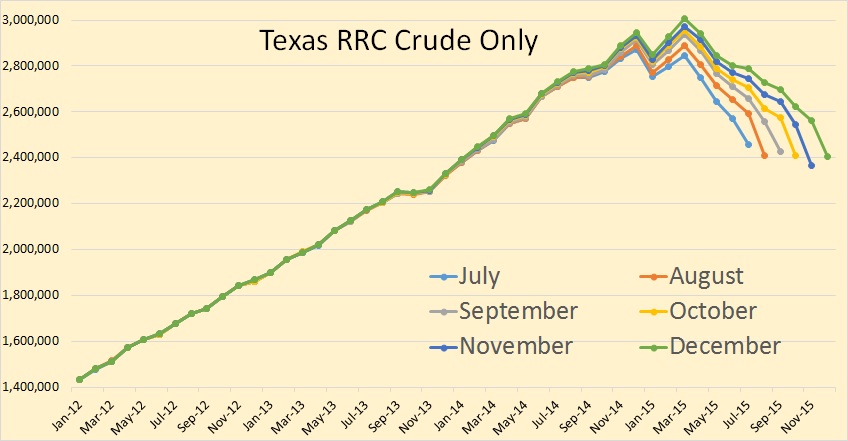
Texas Crude Only

Texas crude only shows basically the same pattern as C+C.
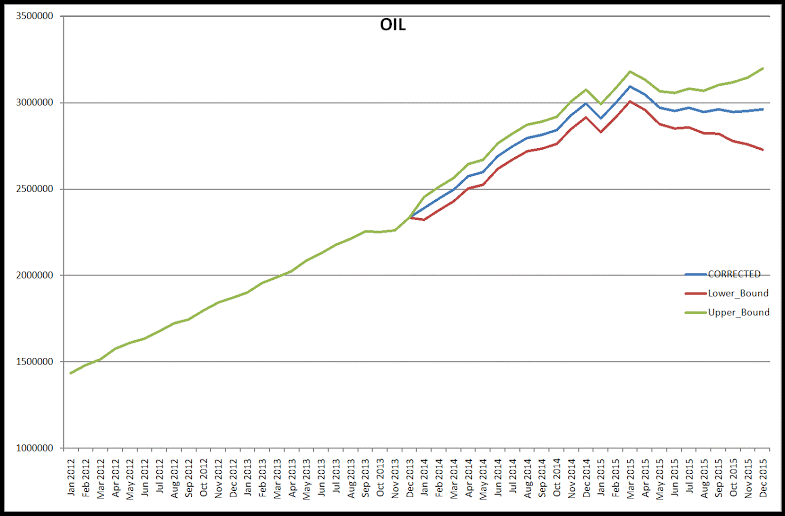
Dean Oil

This is  Moscow's estimate of what the final Texas crude only production will look like.
Texas Condensate

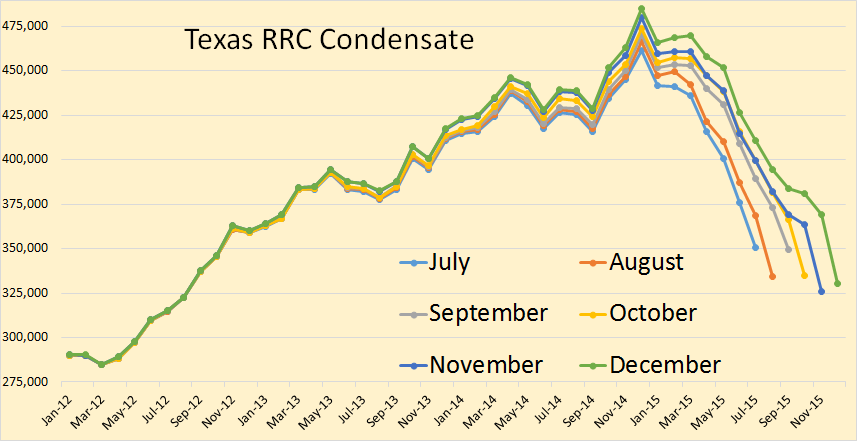
Texas condensate seems to have a slightly steeper decline than does crude only and peaked in December rather than March when crude only peaked. we use the term “peaked” to mean “peaked so far” and we are  not  asserting that it is the final peak. Only time will tell whether it is the final peak or not.
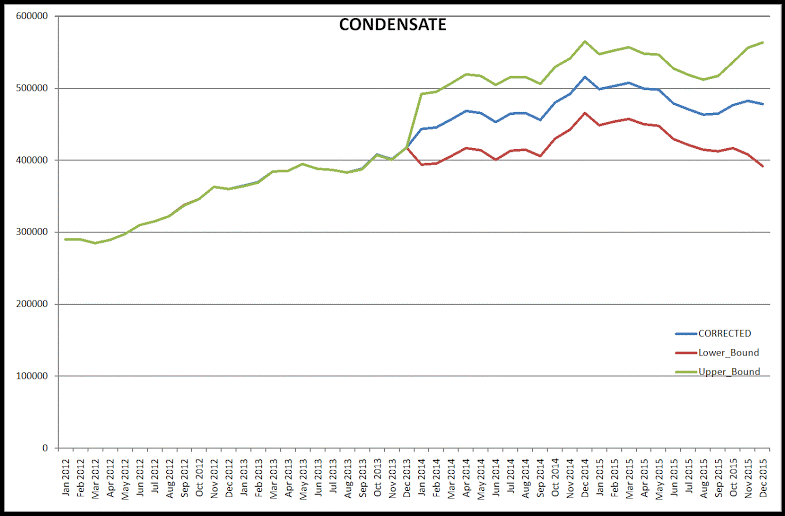
Dean Condensate

  The Russian data agrees that condensate peaked in December.
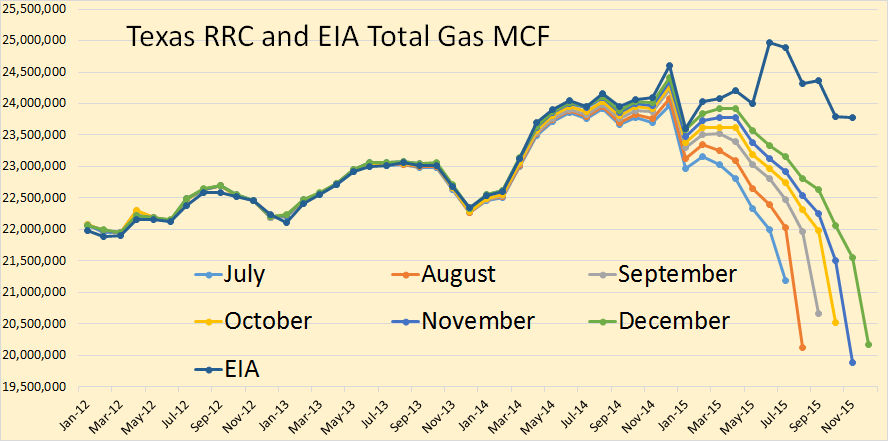
Texas Total Gas
Texas total gas production, according to the EIA, peaked in June, so far, and now seems to be declining a bit faster than oil.
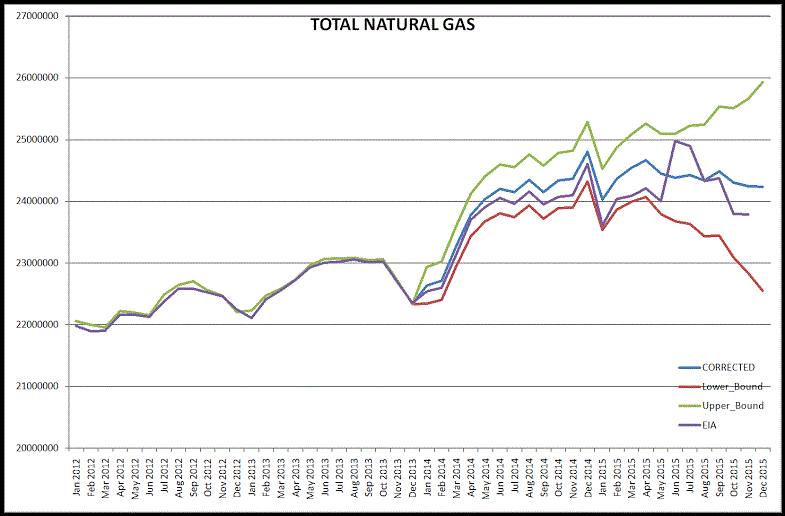
Dean Gas
 Russian numbers  shows Texas total gas production on a plateau with a slow decline. He has Texas gas production, in November, slightly above the EIA’s estimate.
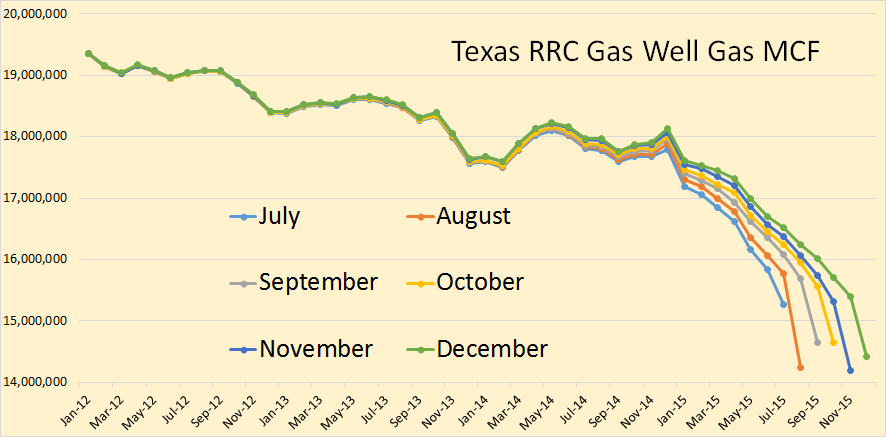
Texas Gas Well Gas
Texas gas well gas actually peaked in early 2009 and has since been in a slow but steady decline.
Texas Assciated Gas
Texas gas production has been kept increasing by the increase of associated gas. The shale oil boom is largely responsible for the increase in Texas associated gas. 

  • Mahjoub Mohamed Salih, WNN News


Tuesday, 16 February 2016

Big Declines Bakken Production


Bakken December Data, Big Decline


Image result for the bakken

The Bakken and North Dakota tight oil production data is out.

Bakken production was down 28,604 barrels per day to 1,096,044 bpd. All North Dakota was down 29,506 bpd to 1,152,280 bpd.

This is just the last two years of the chart above. It gives a slightly better look at what is happening.
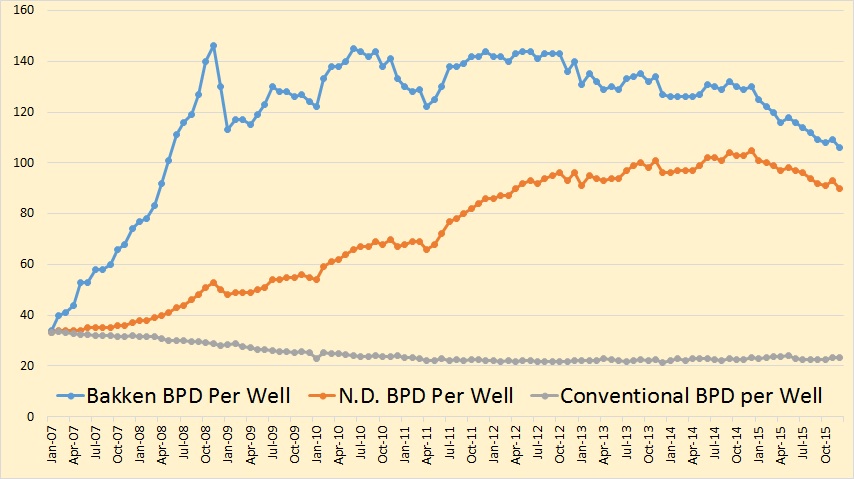
Bakken BPD per Well
Barrels per day per well fell to 106 in the Bakken and to 90 in all North Dakota.

Producing Wells

November 13,100

December 13,119 (preliminary)(all time high was Oct 2015 13,190)
10,756 wells or 82% are now unconventional Bakken–Three forks wells
2,363 wells or 18% produce from legacy conventional pools.
 –
Permitting

November 125 drilling and 0 seismic
December 95 drilling and 0 seismic
January 78 drilling and 0 seismic (all time high was 370 in 10/2012)
 –
ND Sweet Crude Price

November $32.16/barrel
December $27.57/barrel
January $21.13/barrel
Today’s $16.50/barrel
(lowest since February 2002)(all-time high was $136.29 7/3/2008)
 –
Rig Count

November 64
December 64
January 52
Today’s rig count is 41 (lowest since July 2009 when it was 40)(all-time high was 218 on 5/29/2012)
The statewide rig count is down 81% from the high and in the five most active counties rig count is down as follows:
Divide  -85% (high was 3/2013)
Dunn -76% (high was 6/2012)
McKenzie -75% (high was 1/2014)
Mountrail -88% (high was 6/2011)
Williams -90% (high was 10/2014)


  A Final Note :  

The drilling rig count was steady from November to December, fell sharply from December to January, and again into this month. Operators are now even more committed to running fewer rigs as oil prices remain at very low levels. The number of well completions remained steady from 77(final) in November to 76(preliminary) in December. Oil price weakness is now anticipated to last into at least the third quarter of this year and is the main reason for the continued slow-down. There were no significant precipitation events, 5 days with wind speeds in excess of 35 mph (too high for completion work), and 2 days in Williston with temperatures below -10F.

Over 97% of drilling now targets the Bakken and Three Forks formations.
At the end of December there were an estimated 945 wells waiting on completion services 2, 24 less than at the end of November.
Crude oil take away capacity remains dependent on rail deliveries to coastal refineries to remain adequate.

The drop in oil price associated with anticipation of lifting sanctions on Iran and a weaker economy in China is expected to lead to further cuts in the drilling rig count. Utilization rate for rigs capable of 20,000+ feet is about 30% and for shallow well rigs (7,000 feet or less) about 20%.
Drilling permit activity declined November to December then fell further in January as operators continue to position themselves for low 2016 price scenarios. Operators have a significant permit inventory should a return to the drilling price point occur in the next 12 months.


Free Logo From Thefreelogomakers.com


Blog Archive