Storm the Bastille
In the last analysis, globalization has only benefitted the rich and led to the quiet destruction of society and the middle class. We need to become more self-reliant. more centred in our culture and effect policies that bring middle class jobs back to North American shores.
If we fail and continue on globalization's clear path to self destruction, then the possibility of a quiet revolution becomes a greater risk t caused by the freshly minted legions of poor middle-class folks.
History has an odd habit of repeating itself.
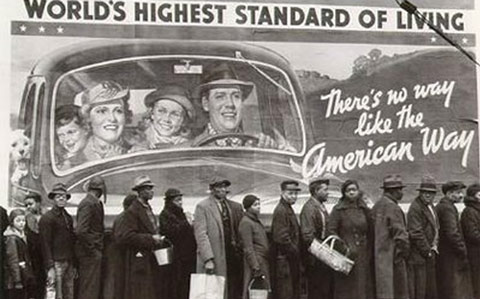
"Let them eat cake'
Why Globalization Reaches Limits
We have been living in a world of rapid globalization, but this is not a condition that we can expect to continue indefinitely.
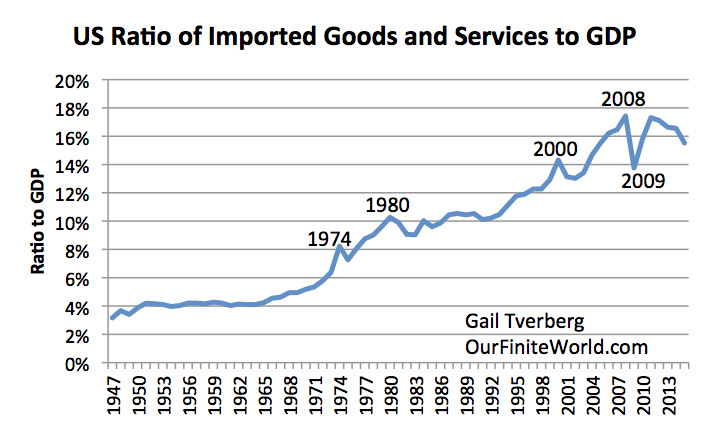
Figure 1. Ratio of Imported Goods and Services to GDP. Based in FRED data for IMPGS.
Each time imported goods and services start to surge as a percentage of GDP, these imports seem to be cut back, generally in a recession. The rising cost of the imports seems to have an adverse impact on the economy. (The imports I am showing are gross imports, rather than imports net of exports. I am using gross imports, because US exports tend to be of a different nature than US imports. US imports include many labor-intensive products, while exports tend to be goods such as agricultural goods and movie films that do not require much US labor.)
 |
| "With the People" |
Recently, US imports seem to be down. Part of this reflects the impact of surging US oil production, and because of this, a declining need for oil imports. Figure 2 shows the impact of removing oil imports from the amounts shown on Figure 1.
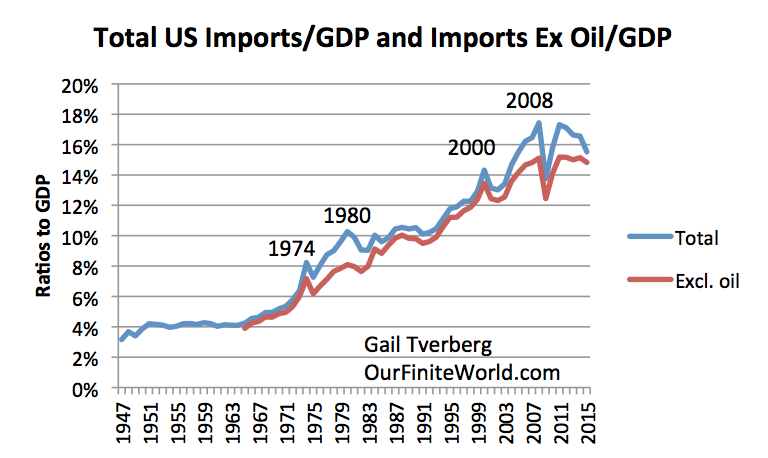
Figure 2. Total US Imports of Goods and Services, and this total excluding crude oil imports, both as a ratio to GDP. Crude oil imports from https://www.census.gov/foreign-trade/statistics/historical/petr.pdf
If we look at the years from 2008 to the present, there was clearly a big dip in imports at the time of the Great Recession. Apart from that dip, US imports have barely kept up with GDP growth since 2008.
Let’s think about the situation from the point of view of developing nations, wanting to increase the amount of goods they sell to the US. As long as US imports were growing rapidly, then the demand for the goods and services these developing nations were trying to sell would be growing rapidly. But once US imports flattened out as a percentage of GDP, then it became much harder for developing nations to “grow” their exports to the US.
I have not done an extensive analysis outside the US, but based on the recent slow economic growth patterns for Japan and Europe, I would expect that import growth for these areas to be slowing as well. In fact, data from the World Trade Organization for Japan, France, Italy, Sweden, Spain, and the United Kingdom seem to show a recent slowdown in imported goods for these countries as well.
If this lack of demand growth by a number of industrialized countries continues, it will tend to seriously slow export growth for developing countries.
Where Does Demand for Imports Come From?
 Many of the goods and services we import have an adverse impact on US wages. For example, if we import clothing, toys, and furniture, these imports directly remove US jobs making similar goods here. Similarly, programming jobs and call center jobs outsourced to lower cost nations reduce the number of jobs available in the US. When US oil prices rose in the 1970s, we started importing compact cars from Japan. Substituting Japanese-made cars for American-made cars also led to a loss of US jobs.
Even if a job isn’t directly lost, the competition with low wage nations tends to hold down wages. Over time, US wages have tended to fall as a percentage of GDP.
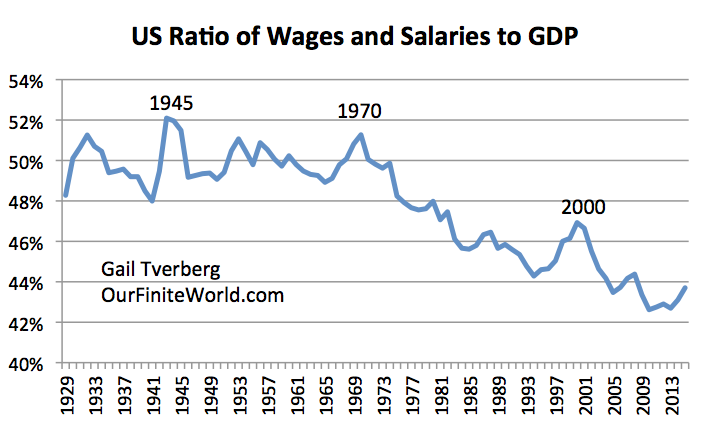
Figure 3. Ratio of US Wages and Salaries to GDP, based on information of the US Bureau of Economic Analysis.

READ MORE


No comments:
Post a Comment